We've joined our RTI Health Solutions colleagues under the RTI Health Solutions brand to offer an expanded set of research and consulting services.
RTI Rarity™ Local Social Inequity Score Offers High Acuity Social Risk Data Analysis
Regulatory imperatives, like the CMS Framework for Health Equity and NCQA Health Equity Accreditation/Plus, are calling payers and providers to address social drivers of health and equity through more robust data collection and analysis. For healthcare organizations looking to achieve more equitable outcomes, the RTI Rarity™ Local Social Inequity (LSI) score reveals key characteristics of higher-risk populations, identifies target interventions to engage them, and supports NCQA requirements.
Why are current social risk scores inadequate?
Without reliable and timely SDoH data and analytics, social needs and inequities are hard to identify and address. Plus, no single data source provides well-grounded information to guide health equity improvement initiatives. Even commonly-used indices — Social Deprivation Index (SDI), the Social Vulnerability Index (SVI), and the Area Deprivation Index (ADI) – draw on a limited set of variables.
A better social risk index includes multiple sources of definitive data
Integrating community-level and individual-level data across multiple attested data sources helps healthcare leaders identify individual and population social needs and conduct more thorough analyses. This approach conjures a higher-resolution picture of individuals' health within the context of populations, geography, and SDoH.
Today, payer and provider organizations have access to sophisticated, robust aggregate population data to more accurately predict health outcomes, identify gaps in care, and measure the impact of policy and program changes.
What is the RTI Rarity Local Social Inequity score?
The RTI Rarity tool merges artificial intelligence (AI), advanced data science methods, and geospatial analytics in a risk adjustment framework. Featuring a supervised machine learning method known as random forests (RFs) and other state-of-the-art predictive analytics methods, it provides high-resolution social determinants of health (SDoH) composite scores constructed with a health equity focus.
What data does the RTI Rarity LSI score leverage?
The RTI Rarity tool creates and delivers the Local Social Inequity (LSI) score by drawing on 40+ public and private datasets from publicly available federal, state, non-profit, and academic resources, including:
- American Community Survey (ACS) from the U.S. Census Bureau
- USDA's Food Environment Atlas
- CDC's Wide-ranging ONline Data for Epidemiologic Research (WONDER)
- Department of Housing and Urban Development (HUD)
- Child Opportunity Index (COI)
- Opportunity Atlas
- and 34+ other datasets
The RTI Rarity LSI score utilizes 200+ area-level variables across 10 domains at the Census, zip code, and county levels for predicting life expectancy and other health outcomes. Together, these scores yield meaningful insights into the neighborhood-level drivers affecting local health outcomes.

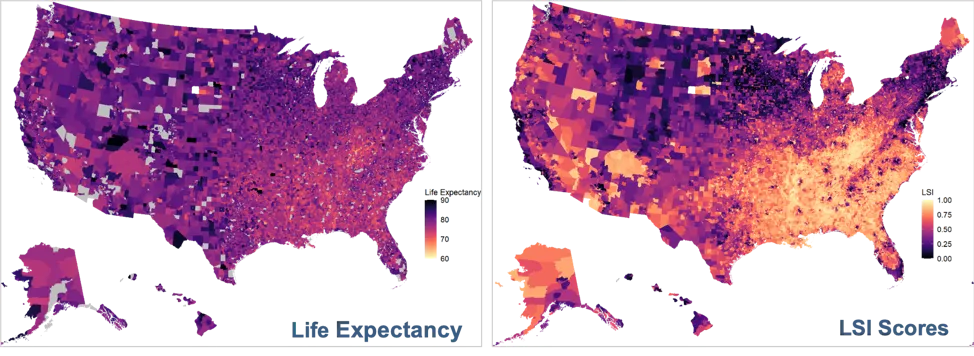
Figure 1: Social inequities have a high impact on life expectancy. Bright yellow indicates lower life expectancy and high social inequities. As social inequities increase, life expectancy decreases.
Why is the Local Social Inequity score a better predictor of social risk and SDoH gaps?
In benchmarking and validation analyses, the RTI Rarity LSI score proved to be substantially better at explaining variance in life expectancy than other commonly used SDoH composite measures. Not only can LSI scores identify which communities are at high risk of poor health outcomes, it identifies the most important social, behavioral, and contextual predictors for those outcomes within neighborhoods across the U.S.
Benchmarking LSI against ADI, SDI, SVI
The RTI Rarity LSI score was benchmarked against three existing area-based composite measures related to SDoH: the Area Deprivation Index (ADI), the Social Deprivation Index (SDI), and the Social Vulnerability Index (SVI). When assessing life expectancy at birth, the LSI score explains more of the variance across the United States:
Indices ranked by ability to account for disparity among neighborhoods with the highest and lowest life expectancies across all U.S. states
| RTI Rarity Local Social Inequity (LSI) Score | 70% |
| Area Deprivation Index (ADI) | 29% |
| Social Deprivation Index (SDI) | 34% |
| Social Vulnerability Index (SVI) | 30% |
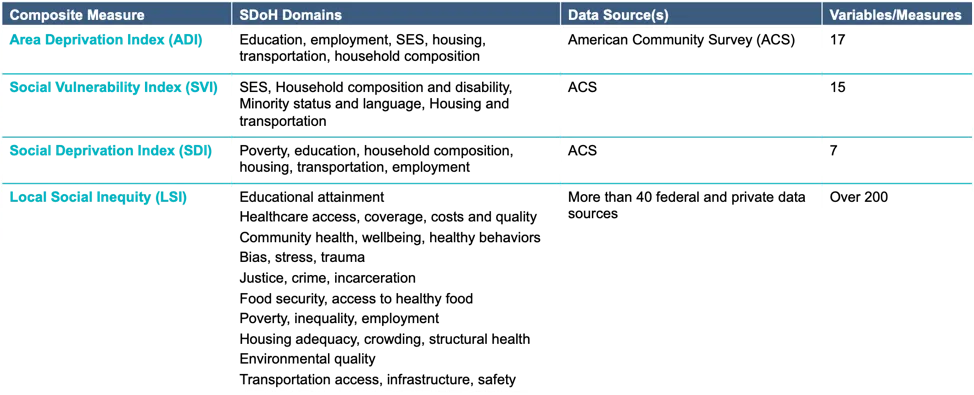
RTI Rarity data are substantially better at explaining variance in life expectancy than other commonly used SDoH composite measures, which is partially related to the number and quality of data sources and measures it incorporates as shown in Figure 2. Most importantly, the RTI Rarity LSI score can more accurately predict mortality at birth than SDI, SVI, and ADI.

Figure 2: SDoH Composite Measures - domains, data sources, and variables included.
Ohio pilot highlights RTI Rarity tool capabilities and potential
The RTI Rarity Local Social Inequity score was piloted using over 140 publicly available variables for a Medicaid innovation in the state of Ohio. It identified the five most important predictors of shorter life expectancy:
- Percentage of the population that received food assistance
- Median owner-occupied property values
- Probability of reaching the top quintile of the national household income distribution (among children born in the same year)
- Having a college degree
- Percent enrolled in Medicaid
RTI Rarity tool reveals variability nationally
The RTI Rarity tool explained 70% of neighborhood variation in life expectancy across the U.S. This was a substantial improvement over commonly used indices that explained only 29-34% of the life expectancy variation nationally.
With a more accurate social risk score now available for every U.S. state and the District of Columbia, as well as national scores for cross-state comparisons, healthcare leaders there have new opportunities to improve health:
- Identify U.S. neighborhoods at highest risk of poor outcomes for better targeting of interventions and resources.
- Understand the impact of healthcare innovations, payment models, and interventions on social drivers of health in high-risk U.S. communities.
- Account for factors outside of U.S. providers' control for more fair and equitable performance/quality measurement, evaluation, risk adjustment, and reimbursement.
The RTI Rarity score support NCQA Health Equity Accreditation/Plus requirements
NCQA's Health Equity Accreditation Plus program provides a framework for executing health equity gap analyses and aligning improvement activities with areas in need of attention and setting the standards for health plans. Until now, incorporating social determinants of health data posed challenges for payers and providers looking to make healthcare more equitable for their members and patients.
According to NCQA, “Federal and state agencies are looking for health organizations that establish guidelines to identify and close gaps in unequal treatment. The emphasis on health equity has become a priority in business: employers increasingly choose to contract only with accredited organizations that deliver high-quality, equitable health care to their employees."
The RTI Rarity tool support NCQA's Health Equity Accreditation/Plus requirements. Specifically, RTI Rarity LSI aids in compliance with HE Plus 2: Collection and Analysis of Community and Individual Data requirement items A, D, and E that address:
- Community-level social risk data integration
- Population segmentation or risk stratification
- Analysis of community-level and individual-level data
Neighborhood-level measurement of SDoH needs complements individual data
Healthcare organizations can no longer rely on single or basic social data sources or indices. When payers and providers integrate individual-level data with RTI Rarity community-level data and LSI score, program leaders and analysts can see the impact of healthcare innovations, payment models, and interventions on SDoH in high-risk communities.
RTI Health Advance works with healthcare organizations to realize their health equity and population health goals. Through data analytics and community health assessment support, our experts work alongside your teams to uncover health issues, establish priorities, and plan action.
Learn more about RTI Health Advance and connect with us.
Subscribe Now
Stay up-to-date on our latest thinking. Subscribe to receive blog updates via email.
By submitting this form, I consent to use of my personal information in accordance with the Privacy Policy.